Workplace analytics — data-driven workplace insights

Most office buildings are only used half the time. BLDNG gives you the facts about how your spaces are actually used. So you can make better decisions about your workplace's future.

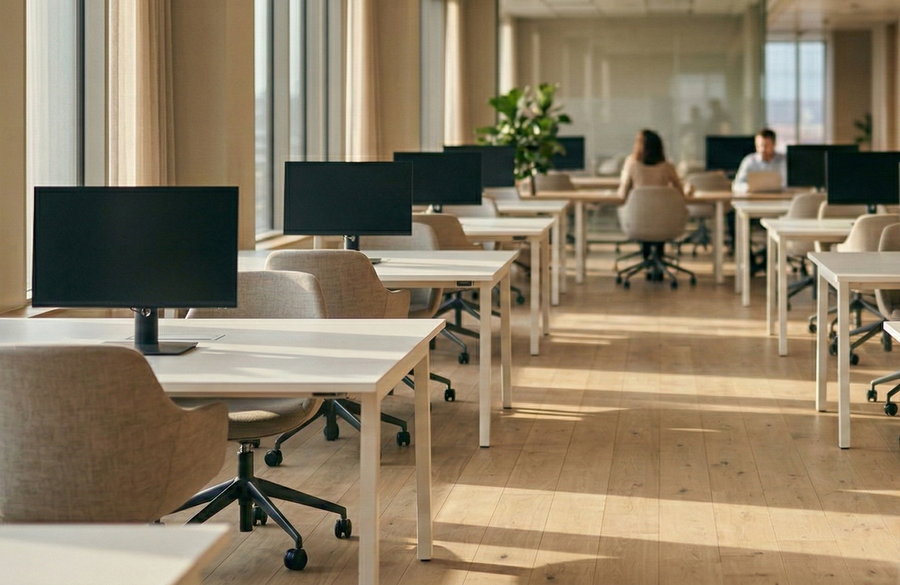
Open-plan office with multiple empty workstations in daylight — illustrating low utilization rates

Do you know how your workplaces really works?

Are you unsure whether your offices are the right size and layout? Most organizations base workspace decisions on gut feeling rather than facts.

The result is often excess square meters, meeting rooms that are rarely fully used, and workstations standing empty most of the week. Workplace analytics gives you the answer - based on data, not assumptions.

The numbers that tell the story

47% Max average utilization
3–5K NOK per sqm/year
2x More space than needed

What is workplace analytics?

Workplace analytics is a data-driven approach to measuring, analyzing, and understanding how physical workspaces are actually used.

Collect data from people counting and usage data for meeting rooms, quiet rooms, and other resources. Get a complete overview of actual use through BLDNG.

Using IoT sensors, booking systems, and other data sources, you gather fact-based insight into occupancy, movement patterns, and space use. The result is a solid basis for decisions about office layout, space requirements, and workplace design.

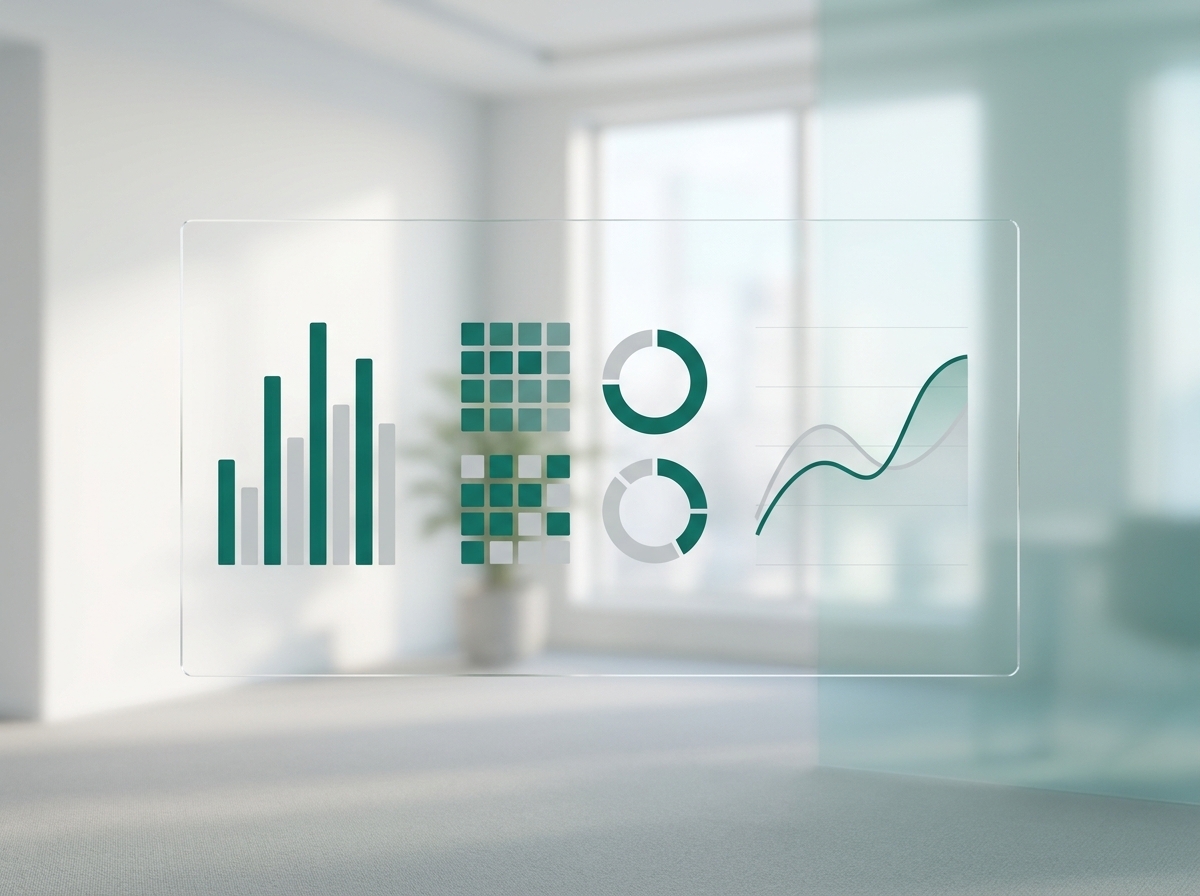
A data dashboard with charts and a heatmap in focus against a calm, blurred office, illustrating data-driven workplace analytics

Data-driven decisions for the hybrid workplace

The office is no longer just a place to work, it's a destination for collaboration, culture, and belonging. You need data that shows how it's actually being used.

📐

Changing your office layout

Planning a renovation or new interior? With data you know which zones are used most, and where there's room for change.

🏗️

Searching for new premises

Looking for new office space? Insights from your current building tell you exactly how many square meters you actually need.

📊

Optimizing your current office

Want to improve the office experience without moving? Data-driven insights show what works and what should change.

Powered by BLDNG.hub

Insights through BLDNG.hub

All workplace data is collected, analyzed, and visualized through BLDNG.hub

  • ✓ Utilization rates per zone, floor, and building
  • ✓ Heatmaps and trend diagrams
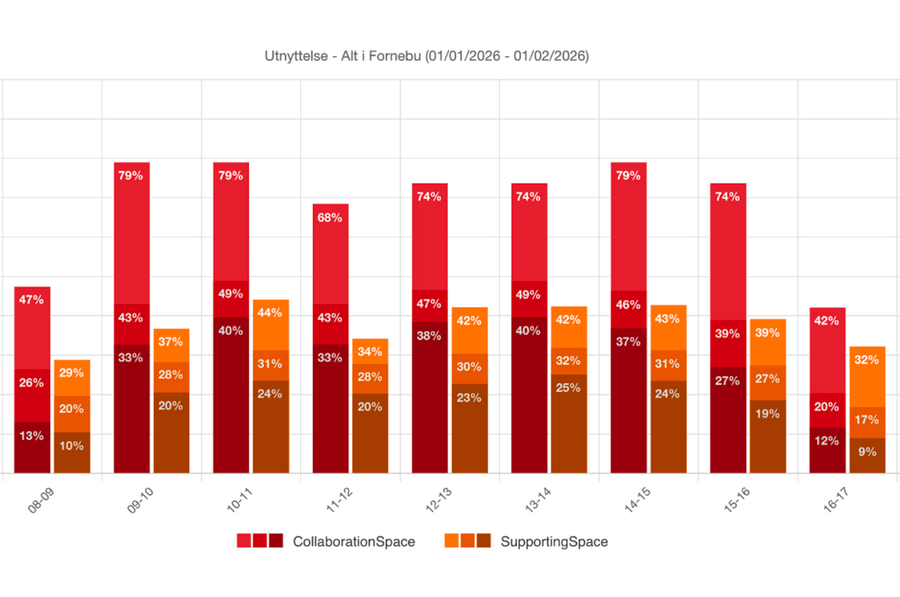
  • ✓ Collaboration vs. supporting space comparison
  • ✓ Data exportable via API

Learn more about BLDNG.hub ➢

 BLDNG.hub dashboard showing utilization rates per zone by time of day — collaboration and supporting spaces in workplace analytics

How can BLDNG help?

1

Needs analysis

We map your needs, building structure, and which data signals deliver the most value.

2

Installation

Sensors are placed in your office spaces. Tested, stable solutions. GDPR-compliant from day one.

3

Data collection

Anonymous data is collected over time and automatically analyzed in BLDNG.hub.

4

Insights & report

You receive a complete analytical foundation with recommendations. From needs analysis to final report.

Ready for data driven decisions?

Let us show you how workplace analytics works in practice. Book a free demo or read how other organizations have used BLDNG.